Discussion thread on Hacker News
So, this post is a bit of a brain dump on rich data structures in Python and what needs to happen in the very near future. I care about them for statistical computing (I want to build a statistical computing environment that trounces R) and financial data analysis (all evidence leads me to believe that Python is the best all-around tool for the finance space). Other people in the scientific Python community want them for numerous other applications: geophysics, neuroscience, etc. It’s really hard to make everyone happy with a single solution. But the current state of affairs has me rather anxious. And I’d like to explain why. For a really quick summary on some of the work I’ve been doing, here’s my SciPy 2010 talk slides:
Data structures with metadata, the backstory
In the wake of SciPy 2011 I’ve been thinking a lot about the way forward from here in terms of building rich Pythonic data structures for statistics and many, many other fields. By rich I mean: is not just a NumPy ndarray, contains metadata (however we define metadata) and has operations which depend on the metadata, and in general does far more than structured arrays currently do for you. This touches on a great many topics and features that people want (partial list):
- Manipulating heterogeneously-typed (what I loosely call “mixed type”) data
- Size mutability: can add easily add “columns” or otherwise N-1-dimensional hyperslices without necessarily copying data
- Metadata about what each axis represents: axis=3 is less meaningful than axis=‘temperature’
- Metadata about axis labels (ticks)
- Label / tick-based data alignment / reshaping, either automatic or explicit
- Label / tick-based (fancy) indexing, both setting and getting
- Hierarchical columns
- Robust handling of missing / NA data (a là R)
- Tons of operations needing heterogeneous data and metadata: group by, filtering, sorting, selection / querying, reindexing (reshaping to conform to a new set of labels), axis selection based on names, etc. etc.
The list goes on and on. I could write a 50-page manuscript on the exact specification of what exact functionality is desired on each of the above bullet points. What I do know is that after using a rich data structure like the ones in pandas, it’s very, very hard to go back to using vanilla ndarrays. To wit, R users coming to Python they have a similar experience: the lack of data.frame and all the functions which operate on data.frames is a gigantic loss of functionality. When I work with MATLAB and R users (especially in the finance industry) and get them up and running with pandas, I get a lot of “where was this tool all my life?”. It’s just that much better. In fact, users can get by with only a very rudimentary understanding of NumPy if the data structures are good enough; I think this is highly desirable. Even for purely interactive data analysis (forget operations which actually utilize the metadata), isn’t this much better:
In [4]: data.corr()
Out[4]:
       AAPL     GOOG     MSFT     YHOO
AAPL   1        0.5724   0.4714   0.3447
GOOG   0.5724   1        0.5231   0.3409
MSFT   0.4714   0.5231   1        0.3012
YHOO   0.3447   0.3409   0.3012   1
than this:
In [11]: np.corrcoef(data.T)
Out[11]:
array([[ 1.    ,  0.5724,  0.4714,  0.3447],
       [ 0.5724,  1.    ,  0.5231,  0.3409],
       [ 0.4714,  0.5231,  1.    ,  0.3012],
       [ 0.3447,  0.3409,  0.3012,  1.    ]])
Of course if data were a structured ndarray you would be completely up a creek (most NumPy functions do not play well with structured arrays). But that’s another topic.
But anyway, to the point of why I’m writing: we have a ton of really talented people with real problems to solve, and lots of great ideas about how to solve them. Last year at SciPy 2010 in Austin we had a Birds of a Feather session led by the venerable Fernando Pérez and myself to talk about the datarray project, pandas, tabular, larry, and other various ideas about data structures that people have kicked around. The topic is important enough that Enthought hosted a gathering this past May in Austin, the DataArray Summit, to talk about these issues and figure out where to go from here. It was a great meeting and we hashed out in gory detail many of the problem areas that we’d like to solve with a richer data structure. So that’s a bit of the backstory.
But even given all these great discussions and work being done, we have a really fundamental problem:
Fragmentation is killing us
There, I said it =) All us NumPy ninjas can navigated the fragmented, incohesive collection of data structures and tools, but it’s confusing as hell for new and existing users. NumPy alone is not good enough for a lot of people (statisticians, financial data analysts, etc.), but they’re left with a confusing choice between pandas, larry, datarray, or something else. Also, these tools have largely not been integrated with any other tools because of the community’s collective commitment anxiety. We talk, hem and haw, and wring our hands. And still no integration. I don’t mean to complain: I just deeply care about making the scientific Python stack the most powerful data analysis stack to ever exist. Seriously. And I can’t do it alone. And I don’t want to make unilateral decisions and shove anything down anyone’s throat. We’ve started working on integration of pandas in statsmodels (which is already going to make a really huge difference), but we need to collectively get our proverbial sh*t together. And soon.
My work on pandas lately and why it matters
On my end, in the 2 months since the DataArray summit, I decided to put my PhD on hold and focus more seriously on Python development, statistics / statsmodels, pandas, and other projects I care deeply about. So I’ve easily invested more time in pandas in the last 2 months than in the previous 2 years. This included heavily redesigned internals (which I’ve extremely pleased with) and tackling various other thorny internal issues which had long been an annoyance for me and an external source of criticism by end users (like, “why are there 2 2-dimensional data structures, DataFrame and DataMatrix?” The answer is that the internal implementation was different, with different performance characteristics depending on use). I’m also trying to clear out my extensive backlog of wishlist features (lots of blog articles to come on these). What’s happened is that I started prototyping a new data structure which I’m calling NDFrame which I think is really going to be a big deal. Basically, the NDFrame is a by-product of the redesigned internal data structure (currently called BlockManager) backing DataFrame and friends. I can and should write an entire post about BlockManager and exactly what it needs to accomplish, but the short story is that BlockManager:
- Stores an arbitrary collection of homogeneously-typed N-dimensional NumPy ndarray objects (I call these Block objects or simple blocks)
- Has axis labels and is capable of reshaping the “blocks” to a new set of labels
- Is capable of consolidating blocks (gluing them together) having the same dtype
- Knows how to appropriately introduce missing data, and upcast dtypes (int, bool) when the missing data marker (NaN, currently. Crossing my fingers for a good NA implementation!) needs to be introduced
- Can deal with single “item” type casts (ha, try to do that with structured arrays!)
- Can accept new blocks without copying data
Maybe this is too abstract for some people. As illustration, here’s literally what’s going on inside DataFrame now after all my latest hacking:
In [40]: df
Out[40]:
    b         a         c       e   f
0   1.213     1.507     True    1   a
1  -0.6765    0.06237   True    1   b
2   0.3126   -0.2575    False   1   c
3   0.1505    0.2242    True    1   d
4  -0.7952    0.2909    True    1   e
5   1.341    -0.9712    False   2   f
6   0.01121   1.654     True    2   g
7  -0.173    -1.385     False   2   h
8   0.1637   -0.898     False   2   i
9   0.5979   -1.035     False   2   j

In [41]: df._data
Out[41]:
BlockManager
Items: [b a c e f]
Axis 1: [0 1 2 3 4 5 6 7 8 9]
FloatBlock: [b a], 2 x 10, dtype float64
BoolBlock: [c], 1 x 10, dtype bool
IntBlock: [e], 1 x 10, dtype int64
ObjectBlock: [f], 1 x 10, dtype object
The user would of course never be intended to look at this, it’s purely internal. But for example things like this are OK to do:
In [42]: df['e'] = df['e'].astype(float)
In [43]: df._data
Out[43]:
BlockManager
Items: [b a c e f]
Axis 1: [0 1 2 3 4 5 6 7 8 9]
FloatBlock: [b a], 2 x 10, dtype float64
BoolBlock: [c], 1 x 10, dtype bool
ObjectBlock: [f], 1 x 10, dtype object
FloatBlock: [e], 1 x 10, dtype float64
Since in that case there are now multiple float blocks, they can be explicitly consolidated, but if you use DataFrame many operations will cause it to happen automatically (which is highly desirable, especially when you have only one dtype, for doing row-oriented operations):
In [44]: df._data.consolidate()
Out[44]:
BlockManager
Items: [b a c e f]
Axis 1: [0 1 2 3 4 5 6 7 8 9]
BoolBlock: [c], 1 x 10, dtype bool
FloatBlock: [b a e], 3 x 10, dtype float64
ObjectBlock: [f], 1 x 10, dtype object
Now, this is a pretty abstract business. Here’s my point: when I started thinking about NDFrame, a user-facing n-dimensional data structure backed by BlockManager, I realized that what I am going to build is a nearly strict superset of the functionality provided by every other rich data structure I know of. I made a picture of the feature overlap, and note that arrows loosely mean: “can be used to implement”:
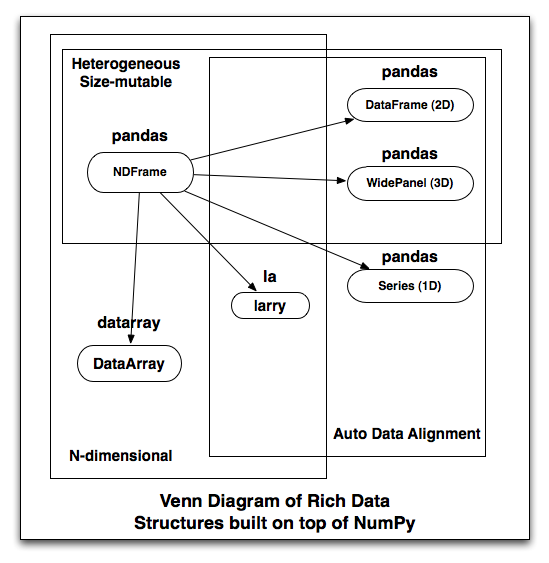
For example, I need to write generic fancy indexing on the NDFrame, a task largely tackled by DataArray. So rather than reinvent the wheel, I should just co-opt that code (love that BSD license), but then I’ve effectively created a fork (nooooo!). I think having all these different libraries (and leaving users the confusing choice between them) is kind of nuts. Ideally DataArray (homogeneous) should just be a part of pandas (and I’m not opposed to changing the name, though it has stronger branding and far more users than datarray or larry). But once we’ve gone down that route, larry is just a DataArray (homogeneous) with automatic data alignment. We’re all doing the exact same kinds of things. So why not have one library?
Remember: the real world is heterogeneously-typed
Some other casual (and potentially controversial) observations
Here’s just a dumping ground of various thoughts I have on this and related topics:
- The NumPy type hierarchy (int8, int16, int32, int64, uint8, uint16, …) isn’t that important to me. R and MATLAB don’t really have a type hierarchy and it doesn’t seem to pose a problem. So I haven’t gone down the road of creating Block objects mapping onto the NumPy type hierarchy. If someone wants to do it without complicating the end-user pandas experience, be my guest
- Tying yourself to the ndarray is too restrictive. This is a major problem with DataArray and larry; they don’t do mixed-type data. So if you want to build something that competes with R you have failed before you have even begun by using a homogeneous-only data structure. Remember, DataFrame can be homogeneous whenever it wants to and getting the underlying ndarray is just a few keystrokes.
- Structured arrays are probably not the answer. Size mutability (ability to add columns) and the ability to change dtypes are actually a big deal. As is the ability to do row-oriented computations, broadcasting, and all the things that structured arrays are (currently) unable to do. They are a darned convenient way of serializing / deserializing data, though. But memory layout and all that is far, far less important to me than usability / user interface / experience